- a PC-program for interactive analysis of reproduction and health in dairy herds.
Iver Thysen (iver@thysen.dk) & Carsten Enevoldsen (ce@life.ku.dk)[Home] [Introduction] [Download Program and Demo Files] [A Veterinarian's User's Guide] [Creating definition and data files]
HerdView uses reproductive and disease events during a 60-week period. You can present individual cows by lifelines with event occurrences shown by symbols, and herd performance by graphs of weekly event counts. A robust change-point procedure reveals changes over time in herd reproductive efficiency, and age-dependencies are visualized by survival graphs.
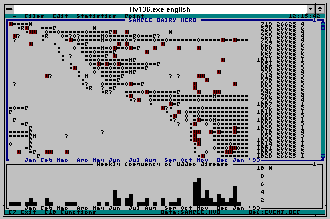
The individual cows' event records are visualized by lifelines in a cow x week matrix with cows in rows and calendar weeks in columns. An event occurring for a particular cow in a particular week is shown by a one-character symbol in the corresponding cell in the matrix. If a cow has more than one event taking place in the same week, the latest events are shown in subsequent weeks.

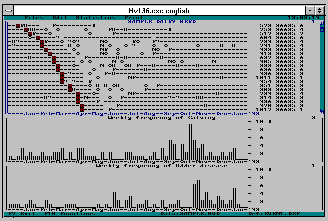
When many cow-lines are presented together, periods with unusal frequencies of events will reveal themselves as patterns in this semi-graphic display. However, it is more convenient to present such irregularities by a bar chart with weekly counts (or percentages) of a certain event over the total period. The example below shows a bar chart of udder treatments, which clearly reveals unsually many treatments in October-November.

When an event is chosen for a bar chart, the display of cow-lines is restricted to the cows having this event and all occurrences of the event are now marked with a red background color. It is thereby easy to identify, for example, cows with multiple occurrences of the event. It is possible to exclude individual cows from the analysis.
In a search for an explanation to the prevalence of udder diseases, a bar chart of calvings can be chosen from the graphics menu. This new chart is tiled on the first chart; it is possible to have 3 charts at the same time. The calving distribution shows many calvings in October, and it is therefore quite reasonable to conclude that this herd has a problem concerning udder health among periparturient cows.

Simple bar charts of weekly counts of event occurrences have turned out to be quite efficient in an initial explanatory analysis of herd health and reproduction. Combinations of different bar charts piled upon each other help to identify herd problems. Bar charts can be produced for selected parities or groupings of cows by other criteria. The built-in association between bar charts and cow-lines, i.e. highlighting the event selected for the bar chart and concentration on cows having experienced that event, gives the opportuntiy to check the data and identify problem cows.
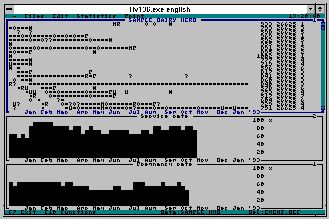
Reproduction efficiency can be analysed by bar charts of insemination rates and pregnancy rates. These rates are computed by a Bayesian methodology yielding robustness against weeks with few or no events, or few or no cows at risk (Thysen & Enevoldsen, 1994). Rates for the period when pregnancy diagnosis no longer are available are in grey, indicating a lower certainty.

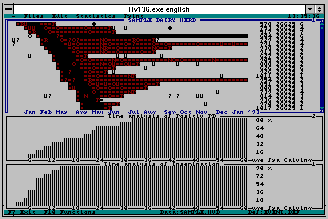
Another way to investigate herd data is to look at associations with time since calving. HerdView can produce bar charts of Kaplan-Meier estimates of, for example as shown below, accumulated percentage of cows served and cows pregnant in relation to weeks since calving (Thysen, 1988). The cow-lines are then highlighting the relevant time period for each cow.
